
eBPF to monitor heap usage of Java app

In the beginning of December 2024 I stumbled upon an interesting tutorial related to eBPF (Extended Berkeley Packet Filter) - Capturing User-Space Java GC Duration Using USDT . The non-invasive approach with eBPF captured my attention because of two important reasons:
It allows to get observability of a running app without requiring any changes in the app
Does not require adding Java agents;
Does not require enabling JFR.
The running app is completely unaware that it is monitored.
This potentially allows getting basic observability of JVM-based apps to be provided on Platform level instead of being responsibility of a developer (to be clear, this isn't a replacement for Java Flight Recorder (JFR) and/or Java Agents like OpenTelemetry Java Agent).
It was super exciting and fun for me to dive into an unknown area and I'm happy to share it with you. Hope you find this interesting as well! The approach is obviously "standing on the shoulders of giants" so to speak and I got inspiration from:
eunomia-bpf project with their eBPF tutorials;
BCC - Tools for BPF-based Linux IO analysis, networking, monitoring, and more;
bpftrace - High-level tracing language for Linux;
What is eBPF program
eBPF program is a lightweight, custom code executed within the Linux kernel in a sandboxed environment that attaches to specific hook points in the kernel or user space applications, enabling real-time monitoring, tracing, and modification of their behavior without requiring changes to the application code. There are many eBPF program types available and we're going to use the following three types:
tracepoint for pre-defined trace points in the Linux Kernel;
uprobe for probing (intercepting and monitoring) userspace entry or exit points;
User-space Statically Defined Tracepoint (USDT) for probing built-in tracepoints in JVM.
We will need bpfcc-tools to help us quickly iterate with ideas, so I'd suggest to install it if you want to try out.
Prototyping with bpfcc-tools
GC-related USDTs in JVM
DTraces are available since JDK6.0 and all subsequent versions have DTrace support, however, DTrace is disabled by default for OpenJDK builds, more in Notes.
The official documentation on DTrace Probes in HotSpot VM contains important details of the probes. DTraces (for Java >= 11) are defined in jdk/src/hotspot/os/posix/dtrace/hotspot.d . We are interested in two GC-related probes:
HOTSPOT_MEM_POOL_GC_BEGIN, probe that fires when an individual memory pool is about to be collected, invoked from jdk/src/hotspot/share/services/memoryManager.cpp#L230
HOTSPOT_MEM_POOL_GC_END, probe that fires after an individual memory pool has been collected, invoked from jdk/src/hotspot/share/services/memoryManager.cpp#L263
Both accept the following arguments:
args[0] - A pointer to UTF-8 string data which contains the name of the manager that manages this memory pool
args[1] - The length of the manager name data (in bytes).
args[2] - A pointer to UTF-8 string data which contains the name of the memory pool.
args[3] - The length of the memory pool name data (in bytes).
args[4] - The initial size of the memory pool (in bytes).
args[5] - The amount of memory in use in the memory pool (in bytes).
args[6] - The number of committed pages in the memory pool.
args[7] - The maximum size of the memory pool.
I'm going to use this simple Java app as a target Java app to monitor heap usage
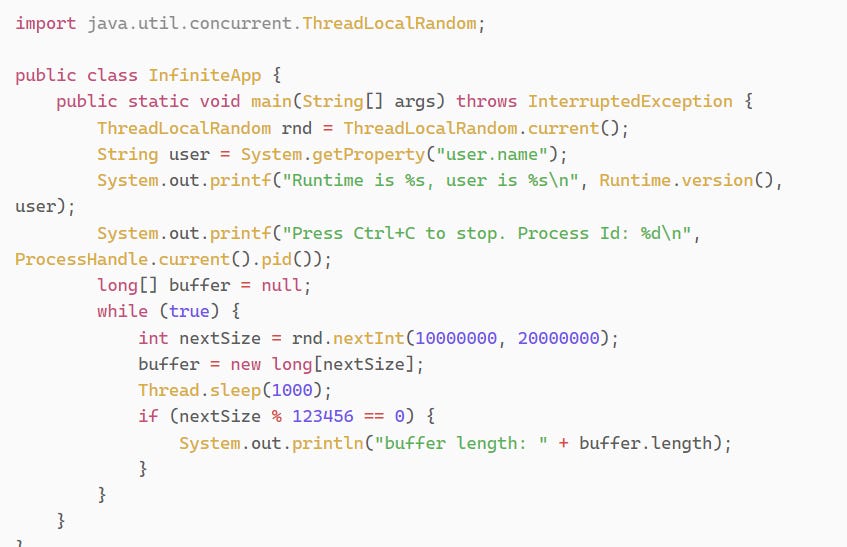
Let's compile and run it in a separate terminal javac InfiniteApp.java && java -Xmx500M InfiniteApp

In a new terminal let's run bpftrace and attach to USDT probe mem__pool__gc__begin of that java process with pid 14435:
sudo bpftrace -p 14435 \
    -e 'usdt:/home/user/.sdkman/candidates/java/21.0.5-zulu/lib/server/libjvm.so:hotspot:mem__pool__gc__begin
{
    printf("manager: %s, pool: %s, init: %d bytes, used: %d bytes\n", str(arg0), str(arg2), arg4, arg5);
}'

To attach to USDT probe mem__pool__gc__end we can modify the command slightly
sudo bpftrace -p 14435 \
    -e 'usdt:/home/user/.sdkman/candidates/java/21.0.5-zulu/lib/server/libjvm.so:hotspot:mem__pool__gc__end
{
    printf("manager: %s, pool: %s, init: %d bytes, used: %d bytes\n", str(arg0), str(arg2), arg4, arg5);
}'

Tracepoint to detect app exits
We will need to have a way to detect when a monitored app exits. It can be done from user space using kill -0 or from the kernel space by attaching to sched/sched_process_exit tracepoint.
sudo bpftrace -p 32613 \
    -e 'tracepoint:sched:sched_process_exit
{
    // Use the correct Java process id!
    if (pid != 32613) { return 0; }

    $task = (struct task_struct *)curtask;
    $exit_code = $task->exit_code >> 8;
    printf("pid: %d, tid: %d, command: %s, exit_code: %d\n", pid, tid, comm, $exit_code);
}'

Uprobe on internal JVM tracing
As I mentioned in Notes, OpenJDK build has DTraces disabled. The approach with USDT won't work unless we build OpenJDK with enabled DTraces. Is there a way to get GC events without DTraces? After reading OpenJDK source code I came-up with the following idea:
JVM internally reports the state of the heap right before GC and immediately after GC
The reporting is done by calling the public method GCTracer::report_gc_heap_summary
Assuming we can find that method in libjvm.so then we can put hook (uprobe) on that method and receive the arguments passed to it. We need to understand the memory layout of C++ class GCHeapSummary to be able to read it from plain C in eBPF.
Finding report_gc_heap_summary
We can use readelf -Ws with grep to check whether a symbol exists in shared library. I checked different versions and builds of Java and all of them contain that symbol. Because it is C++ method, the name is mangled _ZNK8GCTracer22report_gc_heap_summaryEN6GCWhen4TypeERK13GCHeapSummary

As you can notice the found symbol has local binding and hidden visibility. Obviously it is bad idea to rely on hidden functions because it compromises the stability and maintainability and introduces risks related to compatibility (even though report_gc_heap_summary is a public method in GCTracer, developers can change signature, modify the argument's type of that method or even remove that method). But let's try to hook into it just for educational purpose.
Memory layout of GCHeapSummary
I'm not C++ expert, so please take the following with grain of salt. Basically I extracted relevant types to C++ program that finds the offset of the fields. It produces the following result on x64-64
gcc
	➜  /tmp uname -a
	Linux home-lab 6.11.0-13-generic #14-Ubuntu SMP PREEMPT_DYNAMIC Sat Nov 30 23:51:51 UTC 2024 x86_64 x86_64 x86_64 GNU/Linux
	➜  /tmp g++ --version
	g++ (Ubuntu 14.2.0-4ubuntu2) 14.2.0
	Copyright (C) 2024 Free Software Foundation, Inc.
	This is free software; see the source for copying conditions.  There is NO
	warranty; not even for MERCHANTABILITY or FITNESS FOR A PARTICULAR PURPOSE.

	➜  /tmp g++ memory_layout.cpp -o memory_layout
	➜  /tmp ./memory_layout
	sizeof(Type): 4 bytes
		 Type::BeforeGC is 0
		 Type::AfterGC is 1
		 Type::GCWhenEndSentinel is 2
	The offsets of the fields of GCHeapSummary class
		 _heap: 8 bytes
		 _used: 32 bytes
	The offsets of the fields of G1HeapSummary class
		 _heap: 8 bytes
		 _used: 32 bytes
		 _edenUsed: 40 bytes
		 _edenCapacity: 48 bytes
		 _survivorUsed: 56 bytes
		 _oldGenUsed: 64 bytes
		 _numberOfRegions: 72 bytes
clang
	➜  /tmp uname -a
	Linux home-lab 6.11.0-13-generic #14-Ubuntu SMP PREEMPT_DYNAMIC Sat Nov 30 23:51:51 UTC 2024 x86_64 x86_64 x86_64 GNU/Linux
	➜  /tmp clang++ --version
	Ubuntu clang version 19.1.1 (1ubuntu1)
	Target: x86_64-pc-linux-gnu
	Thread model: posix
	InstalledDir: /usr/lib/llvm-19/bin
	➜  /tmp clang++ memory_layout.cpp -o memory_layout
	➜  /tmp ./memory_layout
	sizeof(Type): 4 bytes
		 Type::BeforeGC is 0
		 Type::AfterGC is 1
		 Type::GCWhenEndSentinel is 2
	The offsets of the fields of GCHeapSummary class
		 _heap: 8 bytes
		 _used: 32 bytes
	The offsets of the fields of G1HeapSummary class
		 _heap: 8 bytes
		 _used: 32 bytes
		 _edenUsed: 40 bytes
		 _edenCapacity: 48 bytes
		 _survivorUsed: 56 bytes
		 _oldGenUsed: 64 bytes
		 _numberOfRegions: 72 bytes
We can see that _used field starts at offset 32. Let's try to put uprobe on report_gc_heap_summary and read the data as uint64 starting from that offset
sudo bpftrace -p 69320 \
    -e 'uprobe:/home/user/.sdkman/candidates/java/21.0.5-zulu/lib/server/libjvm.so:_ZNK8GCTracer22report_gc_heap_summaryEN6GCWhen4TypeERK13GCHeapSummary
{
    // void report_gc_heap_summary(GCWhen::Type when, const GCHeapSummary& heap_summary) const;
    // The first arg is pointer to class, we skip it.
    // The second argument, `arg1` indicates whether it is before (0) or after GC  (1)
    // The third argument, `arg2` points to GCHeapSummary. We use 32 bytes offset to read `_used` field
    $offset = (uint64)32;
    $value = *(uint64 *)(arg2 + $offset);
    printf("command: %s, when: %d, used: %d\n", comm, arg1, $value);
}'

Ok, we managed to hook into USDTs, tracepoint and uprobes. However, it is all done using bpftrace tool. It is time now to define on a high level what we want to achieve and convert these small scripts to a Rust application with small C code that uses libbpf-rs to work with eBPF.
Building the tool
Below is a diagram of the system using C4 Model , so-called container diagram. The repository with code is located at REASY/jheapusage

Let's zoom in into jheapusage, the core component that deploys and manages eBPF programs.
jheapusage
It is Rust application that relies on libbpf-rs as tooling for eBPF. On high level it does the following:
Recognizes whether target Java app runs in a container, it can handle namespaces
Checks whether target app is actually a Java app (the check is quite simple, it tries to find
hsperfdatafolder, the same way asjpsdoes in local mode)Estimates system's boot time as Unix timestamp with nanoseconds precision. This is needed because Linux Kernel only provides method bpf_ktime_get_ns that return the time elapsed since system boot!
Finds
report_gc_heap_summarysymbol in libjvm.so to have exact name for uprobeInitializes eBPF and attaches to USDTs, tracepoint and uprobe. During initialization sets the following fields for eBPF program
st_dev
st_ino
target_userspace_pid
boot_time_ns
sampling_interval_ns
Initializes OpenTelemetry for metrics
Creates Ring Buffers to receive GC events from the Kernel and connects them with event handlers. Event handlers push received event as metric to OTLP.
Keeps polling ring buffers while the target app is still running
Simplified C4 component diagram for jheapusage

Rust CLI application has the following code structure:
src/main.rs - the program entry point
src/ebpf.rs - handles loading of eBPF and attaching to different hooks (USDTs, uprobes, tracepoints)
src/ebpf/jvm.bpf.c- eBPF programs written in C with logic defined for the hooks
src/ebpf/jvm.h - common C types and methods used by src/ebpf/jvm.bpf.c
src/ebpf/jvm.skel.rs - auto-generated Rust binding for C eBPF. Generated by build.rs, relies on libbpf-cargo
src/handlers.rs - receives RingBuffer data and pushes them to queue for async processing later
src/events.rs - defines how events are formatted as text and marks events as implementing plain::Plain to simplify C struct to Rust struct convertion
src/isolation.rs - executes provided Rust function in the namespace of target PID. This is needed to get username inside the namespace to be able to find correct
hsperfdatapathsrc/logger.rs - configures and manages tracing logs
src/otlp.rs - exports events to Open Telemetry OTLP endpoint
src/utils.rs - shared utility functions
src/errors.rs - central error type definition
My Eureka Moments
One can understand whether a process runs in a container/namespace isolation by reading
/proc/{pid}/statusfile. Isn't it cool and so simple at the same time? :)No isolation

b. Running in a container

To enter a namespace one can use setns syscall, just need to provide file descriptor and namespace type. nsenter from sys-utils uses it
eBPF subsystem does not provide an API to get current time as Unix timestamp. However, it provides bpf_ktime_get_ns that returns the time elapsed since system boot, in nanoseconds. We can estimate system boot time as Unix timestamp in nanoseconds by estimating the relationship between CLOCK_REALTIME and CLOCK_BOOTTIME using clock_gettime, implementation is in estimate_system_boot_time
bpf_get_current_pid_tgid returns u64 containing the current tgid and pid. tgid is what is process id in user space and pid is what is thread id in users pace. I wrote a helper function extract_userspace_ids to not get confused
To embed skeleton object in Rust struct, libbpf_rs::skelSkel I had to do some unsafe Rust type-system dancing
OTLP + Grafana + Prometheus stack
I used opentelemetry-demo/docker-compose.yml as a base version and modified it to have only what we need. You can find details in jheapusage/otlp folder. To start the stack open shell in that folder and run docker compose up -d

Running example
I created this small video to show the usage of this app.
Notes
OpenJDK builds have DTraces disabled, see JDK-8255612: Explicitly disable dtrace for Oracle OpenJDK Linux builds #946, so I use Azul Zulu Builds of OpenJDK Java 21 (I use SDKMAN! to take care of different versions of Java on my machine). We can confirm that Zulu OpenJDK has DTraces enabled by running
tplist-bpfcc -l #PATH_TO_LIBJVM.SO#to verify the existence of those two traces in libjvm.so:

At the time of writing I used
bpftracev0.21.2;Because of hooking into GC collection events the approach is will only work if there are GC collection, otherwise we won’t receive any events and it will look like Java heap isn’t changing at all (push-based approach). This isn’t the case when pull-based approach is used like in JVM agents when they periodically read memory usage and report it (OpenTelemetry Java Agent uses MemoryPoolMXBean::getUsage, VisualVM uses MemoryMXBean::getHeapMemoryUsage);
I used NotebookLM to create a voice over for this article.