
When Profiler Deadlocks. Debugging a Rust Service Stuck in futex with GDB

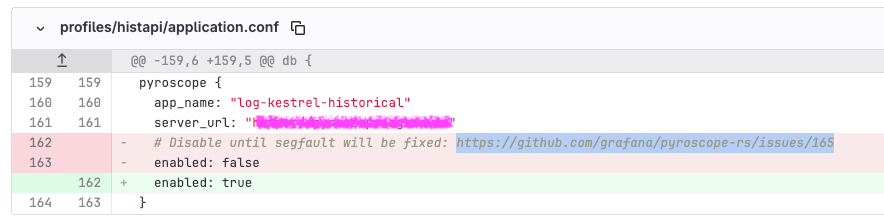
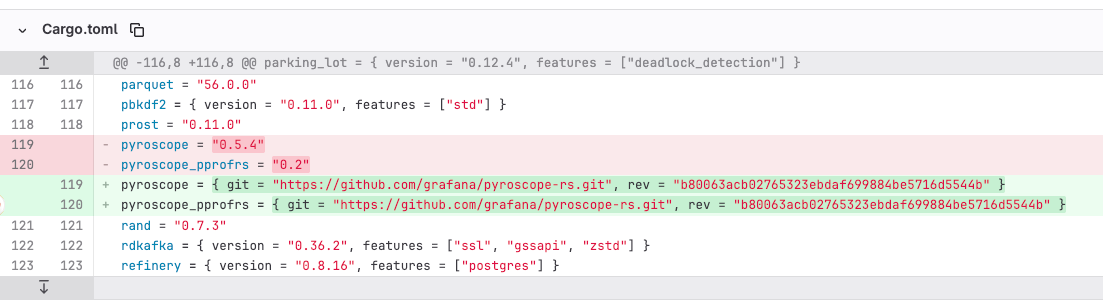
In the beginning of November I did a small and a seemingly innocuous change into our in-house Rust implementation of Loki. The changes were quite simple at the first glance, it just updated Pyroscope to fix Segmentation Fault with Jemalloc and enabled it.
I tested it on QA for a day or so, it worked well and we were quite happy to get back continuous profiling. Continuous profiling is super helpful for us.
We merged and deployed on production. It worked well for some time on production, but suddenly that component just became very slow affecting P99 latency and success rate. It was obvious the changes above are the root cause of it, we rolled back to the previous version to stop the bleeding. It turned out the tool we used to find problems was the problem 🤦♂️.
But what is going on? We let one affected instance run the bad version to analyze and debug the problem.
Initial investigation
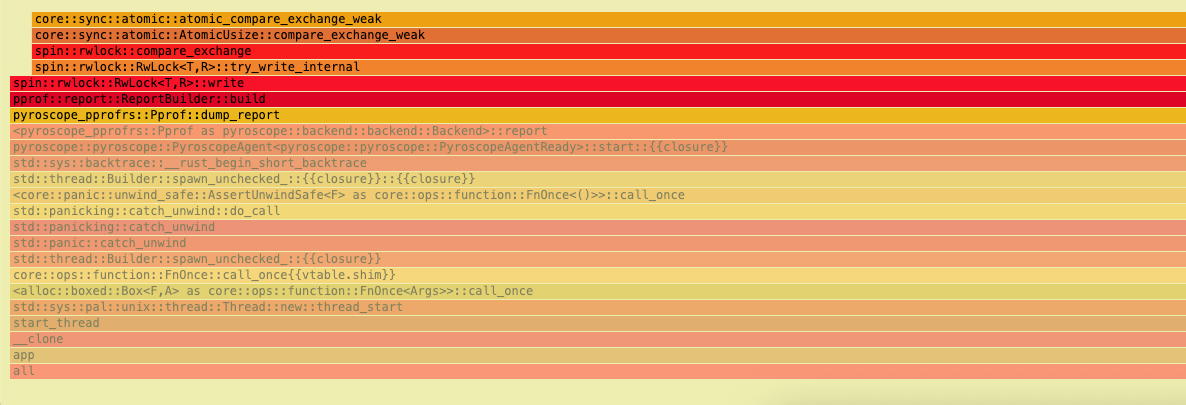
The logs of the affected app would just show a lot of warnings because of the whole component becoming slow. The app was using 1 CPU continuously, and `perf` on it showed some busy waiting happening (spin lock) when Pyroscope writes the report (`Pprof::dump_report`).
All right, we need to dig deeper. Let’s roll up our sleeves and bring GDB into the picture to get more insights. The good thing is we set debuginfo for release build, so we can see proper stack-traces.
[profile.release]
debug = true
It is important to note that we run that system in VMs that we have full access to. The service is run as rootless container. We have all the tooling required like rust-gdb, linux perf and etc that we use for such times. We just SSH to that VM, run a new privileged container that shares PID, NET and IPC namespaces with the target container
sudo docker run --rm -it \
  --privileged \
  --pid=container:TARGET_CONTAINER_ID \
  --net=container:TARGET_CONTAINER_ID \
  --ipc=container:TARGET_CONTAINER_ID \
  --entrypoint /bin/bash \
  IMAGE
Peering into threads
We have a process ID to attach to, so let’s ask GDB to take thread-dump of all the threads
root@host:/# rust-gdb -p 7 -batch -ex "set pagination off" -ex "thread apply all bt" > /tmp/thread_dump.txt

warning: 28	../sysdeps/unix/sysv/linux/recv.c: No such file or directory
Recursive internal problem.
Hm…. Something isn’t right with GDB and/or the state of the app that causes GDB to crash when it tries to take thread dump of all the threads… Quick googling didn’t provide much help and if you know what is going on with GDB, let me know (we use Ubuntu 24.04 with GNU gdb (Ubuntu 15.0.50.20240403-0ubuntu1) 15.0.50.20240403-git).
Is this all we can? Nothing to lose at this point, let’s try some other GDB commands. Maybe we can see all the threads?
root@host:/# rust-gdb -p 7 -batch -ex "set pagination off" -ex "info threads"It worked! The full output, and the important part is below:
| (gdb) info threads | |
| Id Target Id Frame | |
| 13 Thread 0x7fb1b128a6c0 (LWP 193) "tokio-runtime-w" futex_wait (private=0, expected=2, futex_word=0x7fb366e146a8) at ../sysdeps/nptl/futex-internal.h:146 | |
| 44 Thread 0x7fb1b62a96c0 (LWP 162) "tokio-runtime-w" futex_wait (private=0, expected=2, futex_word=0x7fb366e146a8) at ../sysdeps/nptl/futex-internal.h:146 | |
| 77 Thread 0x7fb1ba4ca6c0 (LWP 129) "tokio-runtime-w" futex_wait (private=0, expected=2, futex_word=0x7fb366e146a8) at ../sysdeps/nptl/futex-internal.h:146 | |
| 109 Thread 0x7fb1be4ea6c0 (LWP 97) "tokio-runtime-w" futex_wait (private=0, expected=2, futex_word=0x7fb366e146a8) at ../sysdeps/nptl/futex-internal.h:146 | |
| 136 Thread 0x7fb2e8df86c0 (LWP 65) "chunk-reader" futex_wait (private=0, expected=2, futex_word=0x7fb366e146a8) at ../sysdeps/nptl/futex-internal.h:146 | |
| 170 Thread 0x7fb367dfe6c0 (LWP 26) "otlp-worker" futex_wait (private=0, expected=2, futex_word=0x7fb366e146a8) at ../sysdeps/nptl/futex-internal.h:146 | |
| 182 Thread 0x7fb37c9ff6c0 (LWP 14) "app" futex_wait (private=0, expected=2, futex_word=0x7fb366e146a8) at ../sysdeps/nptl/futex-internal.h:146 |
You can see all these threads are sleeping until a shared resource, protected by a lock at address 0x7fb366e146a8, becomes available. It is done via a syscall to fast user-space mutex, futex. Memory address 0x7fb366e146a8 is likely of pthread_mutex_t (and __pthread_mutex_s if you’re curios to know what is inside 😀)
What thread is the owner of that mutex?
(gdb) p *(pthread_mutex_t *)0x7fb366e146a8
$1 = {__data = {__lock = 2, __count = 0, __owner = 26, __nusers = 1, __kind = 512, __spins = 0, __elision = 0, __list = {__prev = 0x0, __next = 0x0}}, __size = "\002\000\000\000\000\000\000\000\032\000\000\000\001\000\000\000\000\002", '\000' <repeats 21 times>, __align = 2}
Note __owner=26, it points to Light-Weight Process ID (LWP). LWP is the term the Linux Kernel uses for a thread. To the Linux Kernel scheduler (the part of the OS that decides what runs on the CPU), there isn’t a huge distinction between a process and a thread. They are both “schedulable entities” called “tasks.” The LWP ID is the unique identifier the Kernel uses for each of those threads.
LWP 26 is a thread with id 170, let’s get a thread dump (full version)
(gdb) thread 170
[Switching to thread 170 (Thread 0x7fb367dfe6c0 (LWP 26))]
#0  futex_wait (private=0, expected=2, futex_word=0x7fb366e146a8) at ../sysdeps/nptl/futex-internal.h:146
warning: 146	../sysdeps/nptl/futex-internal.h: No such file or directory
(gdb) bt
#0  futex_wait (private=0, expected=2, futex_word=0x7fb366e146a8) at ../sysdeps/nptl/futex-internal.h:146
#1  __GI___lll_lock_wait (futex=futex@entry=0x7fb366e146a8, private=0) at ./nptl/lowlevellock.c:49
#2  0x00007fb3d3f26101 in lll_mutex_lock_optimized (mutex=0x7fb366e146a8) at ./nptl/pthread_mutex_lock.c:48
#3  ___pthread_mutex_lock (mutex=mutex@entry=0x7fb366e146a8) at ./nptl/pthread_mutex_lock.c:93
#4  0x00005648ca696ac2 in malloc_mutex_lock_final (mutex=0x7fb366e14668) at include/jemalloc/internal/mutex.h:151
#5  _rjem_je_malloc_mutex_lock_slow (mutex=mutex@entry=0x7fb366e14668) at src/mutex.c:90
#6  0x00005648ca63d74f in malloc_mutex_lock (mutex=<optimized out>, tsdn=<optimized out>) at include/jemalloc/internal/mutex.h:217
#7  _rjem_je_arena_cache_bin_fill_small (tsdn=<optimized out>, arena=<optimized out>, cache_bin=<optimized out>, cache_bin_info=<optimized out>, binind=<optimized out>, nfill=<optimized out>) at src/arena.c:972
#8  0x00005648ca69f28e in _rjem_je_tcache_alloc_small_hard (tsdn=tsdn@entry=0x7fb367dfd7f0, arena=arena@entry=0x7fb366e01040, tcache=tcache@entry=0x7fb367dfdb48, cache_bin=cache_bin@entry=0x7fb367dfdb80, binind=binind@entry=2, tcache_success=tcache_success@entry=0x7fb367df4890) at src/tcache.c:238
#9  0x00005648ca633f8d in tcache_alloc_small (slow_path=<optimized out>, zero=false, binind=2, size=<optimized out>, tcache=<optimized out>, arena=<optimized out>, tsd=0x7fb367dfd7f0) at include/jemalloc/internal/tcache_inlines.h:68
#10 arena_malloc (slow_path=<optimized out>, tcache=<optimized out>, zero=false, ind=2, size=<optimized out>, arena=0x0, tsdn=0x7fb367dfd7f0) at include/jemalloc/internal/arena_inlines_b.h:151
#11 iallocztm (slow_path=<optimized out>, arena=0x0, is_internal=false, tcache=<optimized out>, zero=false, ind=2, size=<optimized out>, tsdn=0x7fb367dfd7f0) at include/jemalloc/internal/jemalloc_internal_inlines_c.h:55
#12 imalloc_no_sample (ind=2, usize=32, size=<optimized out>, tsd=0x7fb367dfd7f0, dopts=<synthetic pointer>, sopts=<synthetic pointer>) at src/jemalloc.c:2398
#13 imalloc_body (tsd=0x7fb367dfd7f0, dopts=<synthetic pointer>, sopts=<synthetic pointer>) at src/jemalloc.c:2573
#14 imalloc (dopts=<optimized out>, sopts=<optimized out>) at src/jemalloc.c:2687
#15 _rjem_je_malloc_default (size=<optimized out>) at src/jemalloc.c:2722
#16 0x00005648ca596faf in alloc::alloc::alloc (layout=...) at /rustc/29483883eed69d5fb4db01964cdf2af4d86e9cb2/library/alloc/src/alloc.rs:94
#
It is a long thread dump. And jemalloc (yes, we use it in our project) is waiting on the mutex…
I decided to get a help from LLM, Gemini 3 Pro, and you know, it did find what’s wrong, check the conversation.
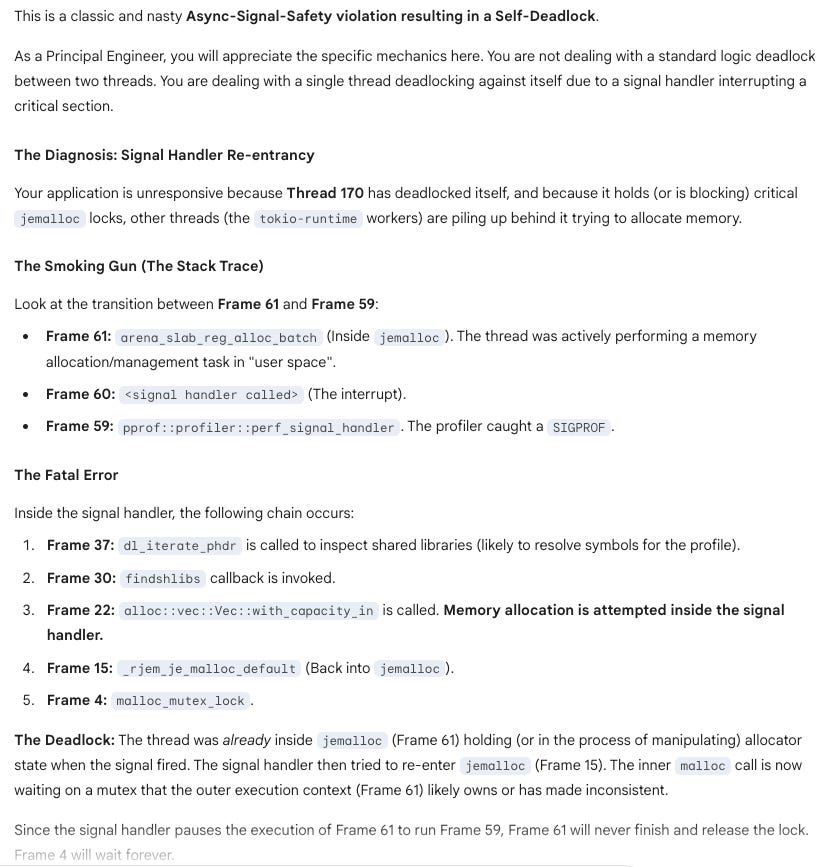
I cross check the diagnosis, and it is right! Basically performing memory allocation within a Linux signal handler is generally considered unsafe and should be avoided. Signal handlers are asynchronous and execute in a restricted context, meaning they can interrupt the main program flow at any point. This can lead to various issues when interacting with memory allocation functions. List of safe save functions are listed in https://man7.org/linux/man-pages/man7/signal-safety.7.html and malloc isn’t there.
The root of the service degradation lies in jemalloc’s scalable design. To improve throughput, jemalloc uses multiple independent arenas, each with its own lock. The lock is a non-reentrant one, so an attempt by a thread to acquire a jemalloc lock it already holds will result in a deadlock and this is what we see in a thread dump of thread 170. Threads are distributed across these arenas. In our case, the signal handler caused a deadlock on the lock of one specific arena. Consequently, any other worker thread that happened to be assigned to that same arena would also block forever the next time it tried to allocate memory. This created a cascading failure for a subset of our workers, increasing P99 latency while allowing other parts of the service to limp along.
The good news, this issue was recently fixed in pprof-rs, framehop: remove the allocation in signal handle of framehop, so make sure you pin to the right release/commit in your Cargo.toml
Conclusion
Ultimately, this deadlock wasn’t just a bug to be squashed; it was an invitation to look under the hood. It would have been easy to swap out the profiler or restart the system and move on, but that would have left a gap in understanding.
This is where curiosity becomes the most critical tool in a software engineer’s belt. Taking the hard path — diving into GDB, dissecting stack traces, and mapping out the interaction between jemalloc and signal handlers — is uncomfortable at first. It feels dense and often frustrating. But it is exactly this friction that sharpens our intuition. By refusing to treat our dependencies as black boxes, we gain a mastery over our systems that simply cannot be learned from high-level documentation. The hard path is longer, but the view of how your software actually works is worth every step.
With the help of powerful LLMs, we gain a significant advantage in troubleshooting. But it’s crucial to remember their role: they provide hypotheses, not ground truth. Our expertise as engineers is more critical than ever — first, to provide the right context and data, and second, to always validate the output before acting on it. Trust, but verify!
Key Takeaways
Curiosity is your most critical tool. It pushes you to go beyond surface-level fixes;
Don’t fear the “black box.” True system mastery comes from diving into your dependencies (jemalloc, glibc, etc.) instead of just using them;
The hard path pays off. While uncomfortable, deep debugging builds an intuition that documentation alone can never provide;
Always enable debug symbols (
debug = true) in release builds. You’ll thank yourself later;Never call non-signal-safe functions (like
malloc) from a signal handler. Check thesignal-safety(7)man page;gdbis an invaluable tool for inspecting the state of live, containerized processes, even for Rust;LLMs can be powerful debugging partners, but they require your expertise to guide them and validate their output.