
Python Threads: GIL vs Free-Threading

For years, Python threads don’t speed up CPU-bound work has been one of those truths that felt less like a technical statement and more like a life philosophy.
Then Python’s free-threading build showed up and basically said: “Hold my espresso.”
This post compares the same multi-threaded program run two ways:
Standard CPython (GIL enabled)
Python 3.14 free-threading build (GIL disabled)
…and we’ll look at two kinds of evidence:
A timeline visualization of thread scheduling (the pretty picture)
/usr/bin/time -pv(the “your OS is now the witness” evidence)
The Boring Benchmark That Tells the Truth
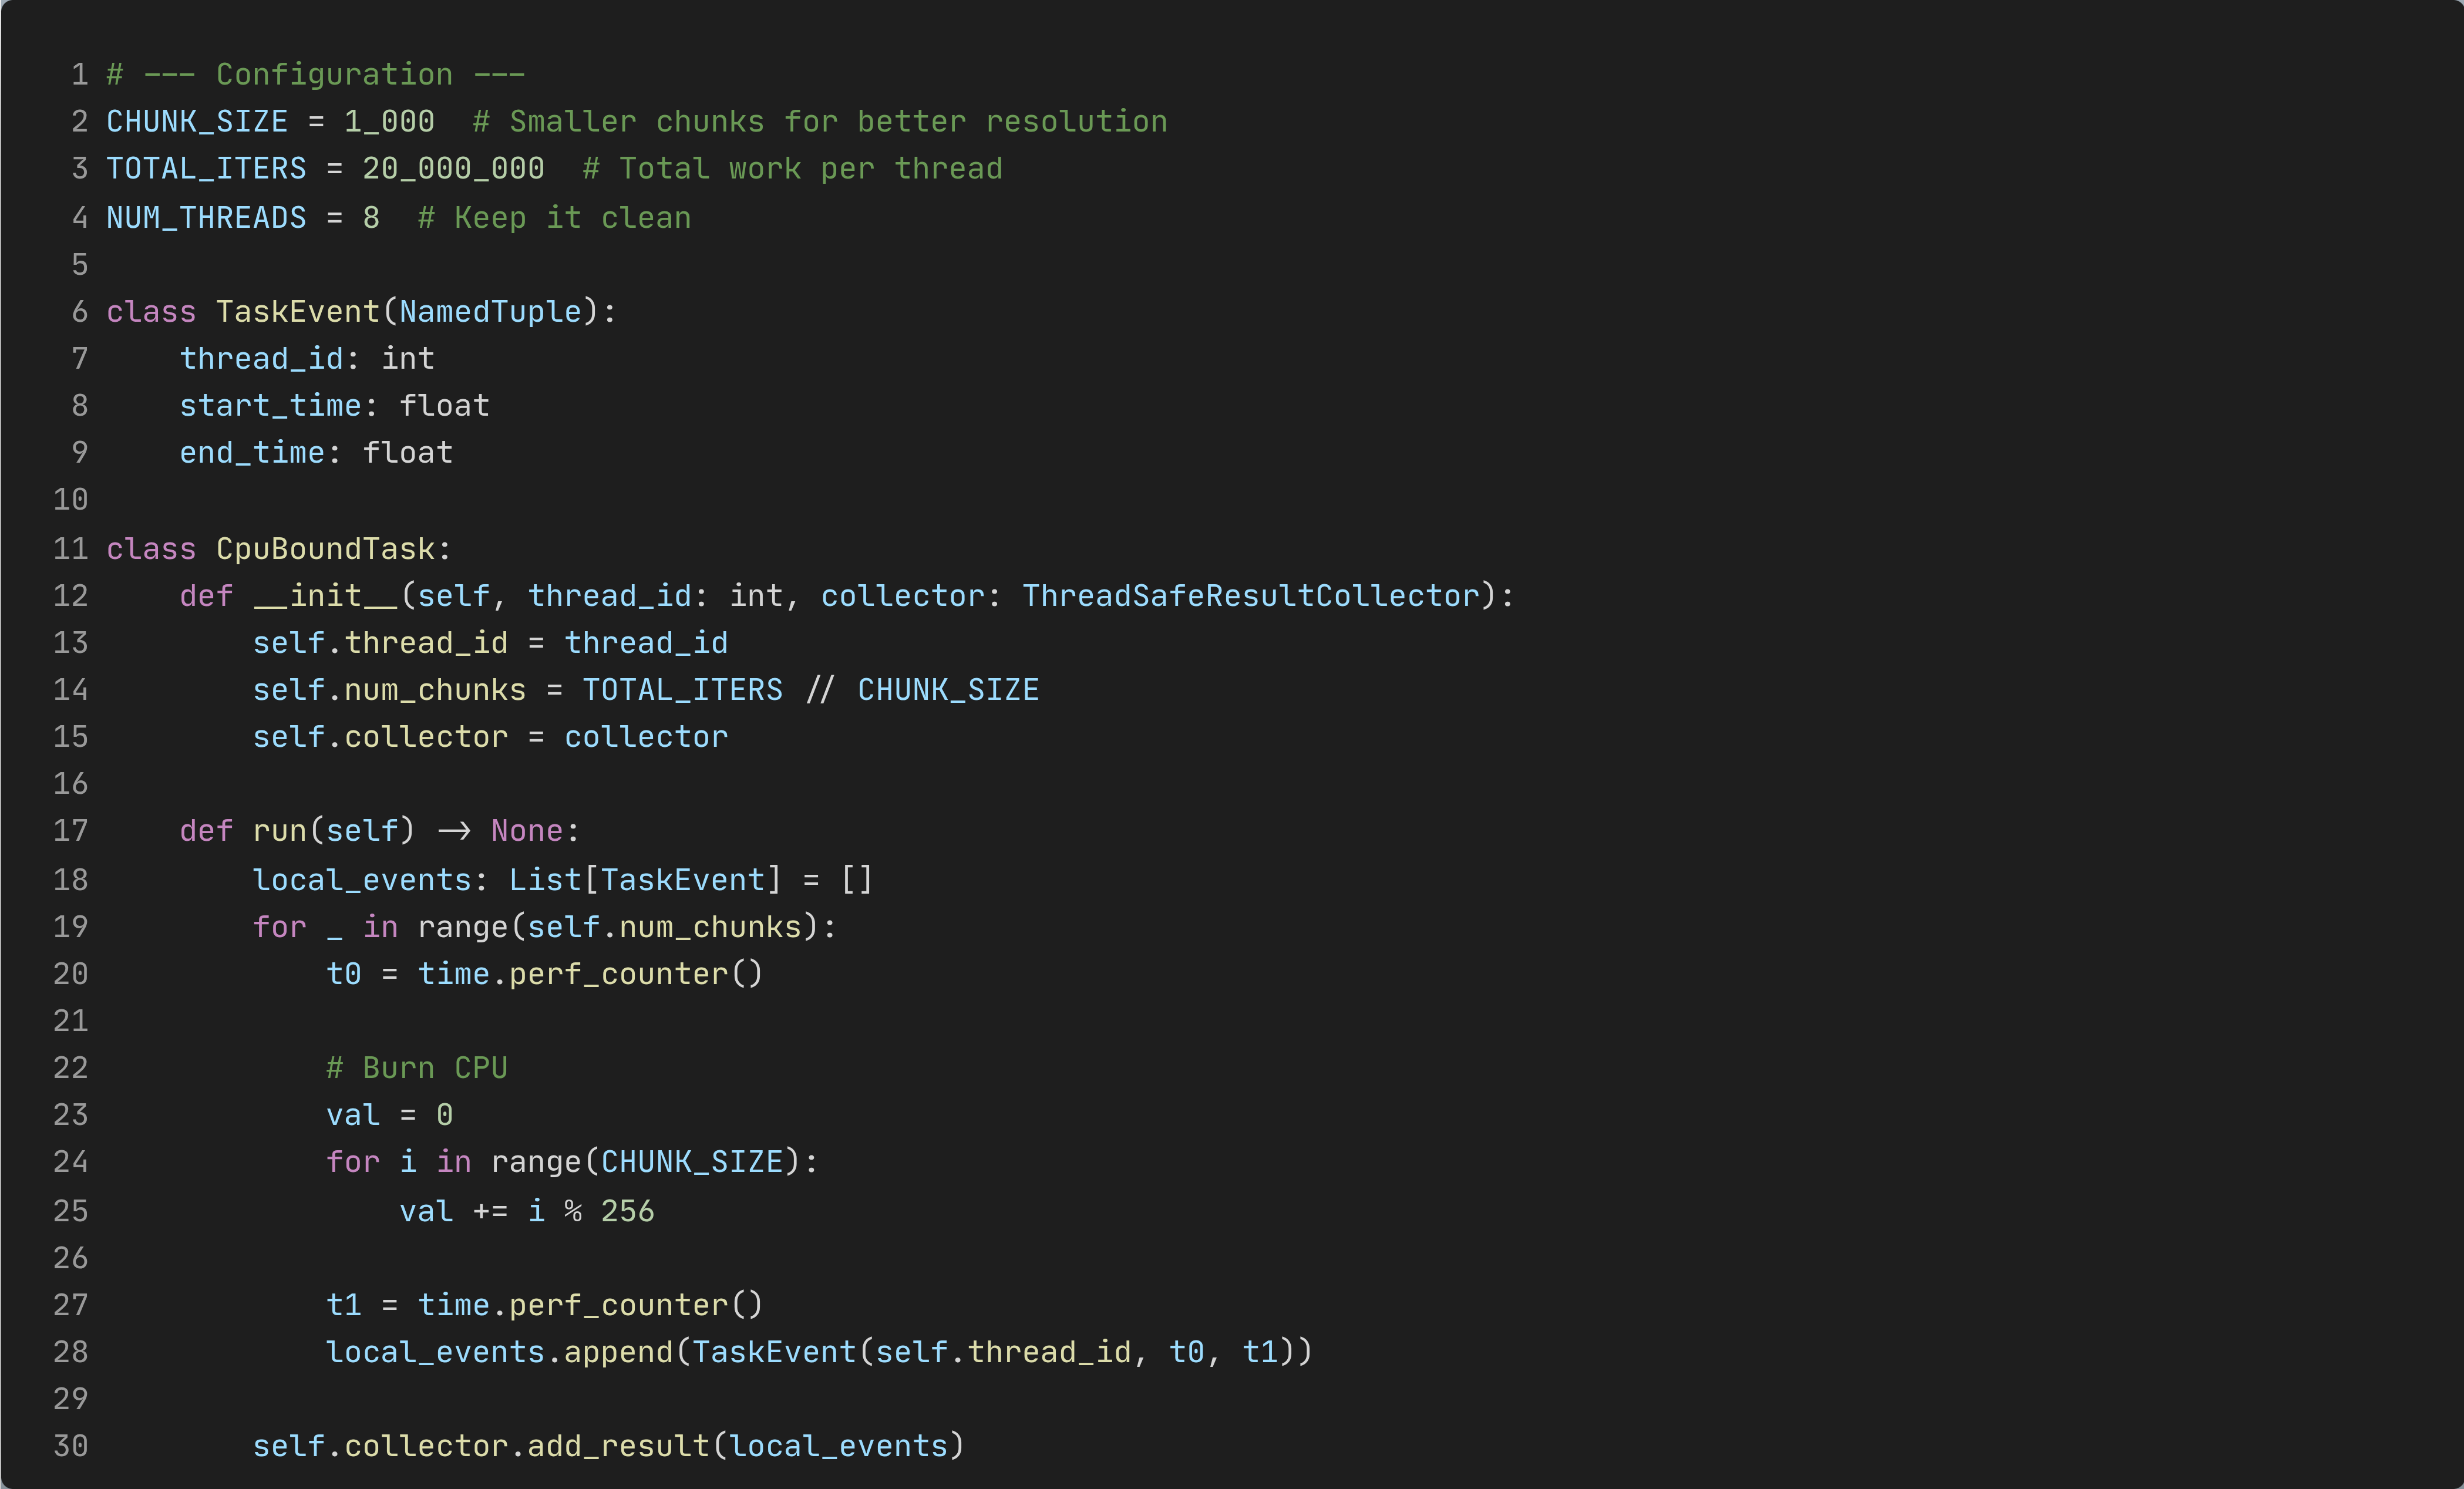
The test is CPU-bound on purpose: each thread runs a tight numeric loop, broken into fixed-size chunks. Each chunk gets timed using perf_counter() so we can visualize how the threads interleave.
Why chunking? Because if each thread runs one huge loop, you learn “it took X seconds” and nothing else. Chunking turns “X seconds” into a story. Check the full code of the benchmarking script gil_threads.py
Also: the script prints results to stdout by default (so /usr/bin/time -pv stays clean), and only draws plots if VISUALIZE=1 is set. That keeps measurement and visualization from stepping on each other.
How to run it
# Free-threading build (no GIL)
uv run --python 3.14t /usr/bin/time -pv python gil_threads.py

# Standard build (GIL)
uv run --python 3.14+gil /usr/bin/time -pv python gil_threads.py
Optional visualization:
# Free-threading build (no GIL)
VISUALIZE=1 uv run --with matplotlib --python 3.14t python gil_threads.py

# Standard build (GIL)
VISUALIZE=1 uv run --with matplotlib --python 3.14+gil gil_threads.py
Exhibit A: the timeline plots
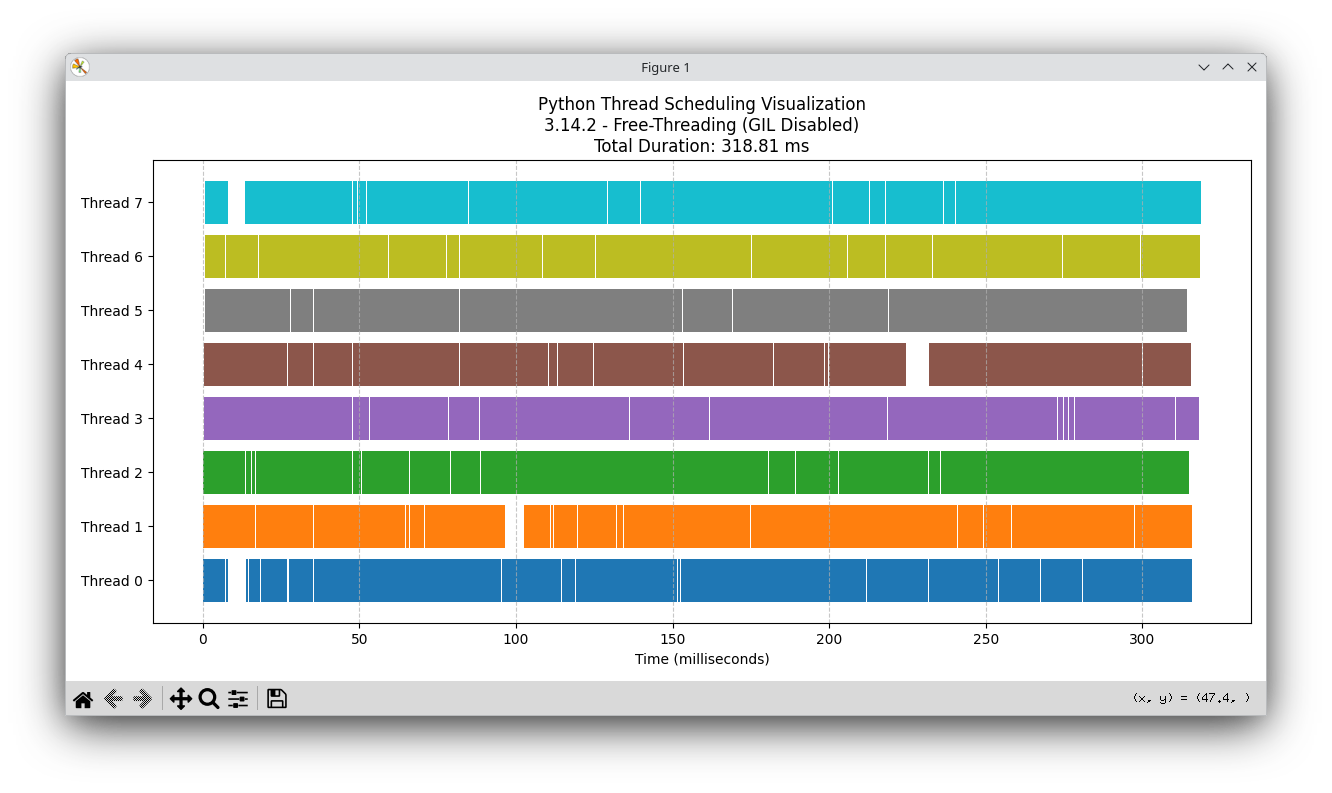
Free-threading (GIL disabled)
You can actually see parallelism: every thread is active across the same wall‑clock window.
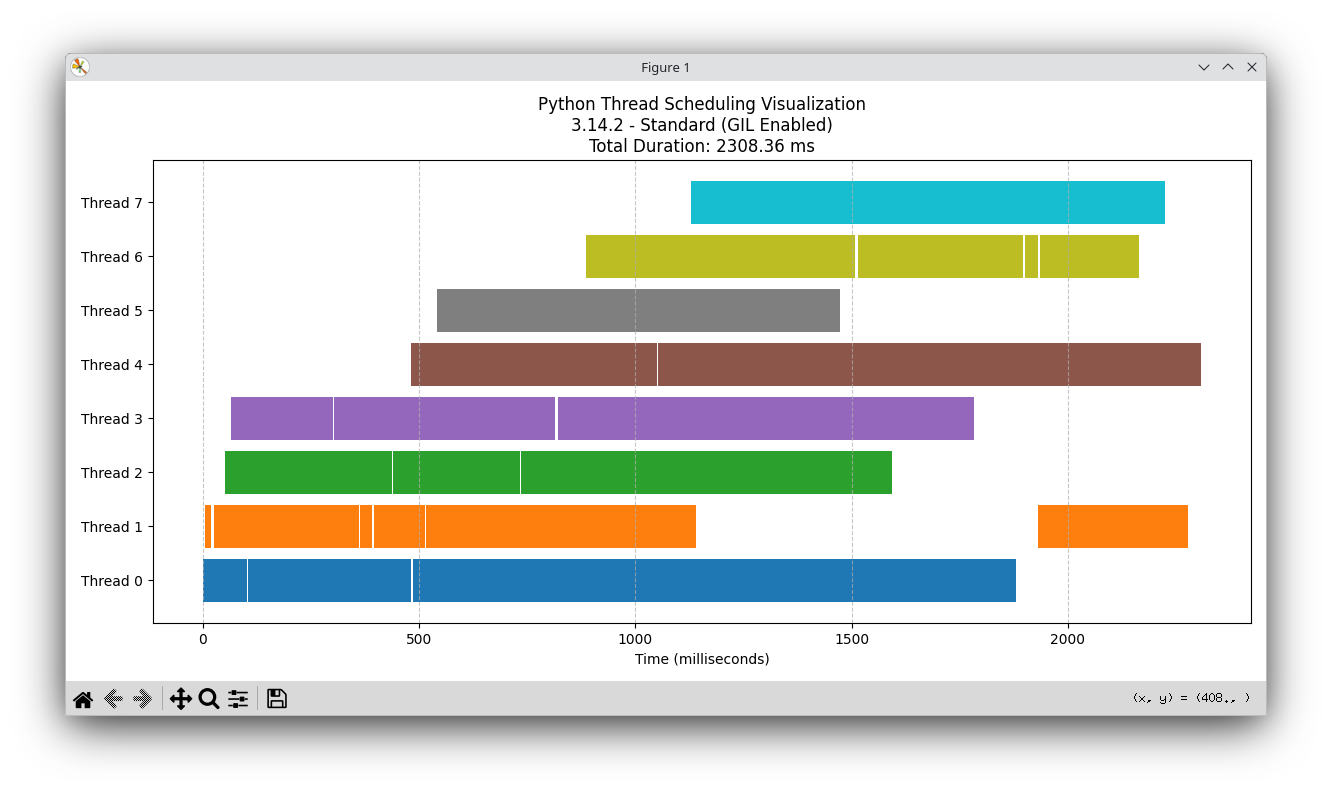
Standard CPython (GIL enabled)
This is the classic “everyone takes turns at the single microphone” vibe.
How to read these
Each colored block is one chunk measured from start_time → end_time.
That duration is wall time, not pure CPU time.
A chunk’s wall time can include pauses: preemption, waiting, lock contention, etc.
So the timeline answers: “When did each thread appear busy?”
Not: “How many cores did we actually burn doing useful compute?”
To separate ‘looks busy’ from ‘actually used CPU’, we ask /usr/bin/time -pv to referee.
Exhibit B: /usr/bin/time -pv
time -pv gives you (yes, it is GNU’s time):
Elapsed wall time (what humans feel)
User time (CPU time spent in user space across all threads)
Percent of CPU (roughly “how many cores did you use on average?”)
Quick rule of thumb:
100% ≈ one full core, 650% ≈ ~6.5 cores, etc.
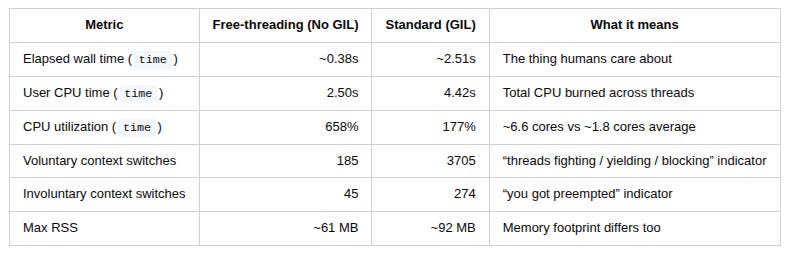
Free-threading run (No GIL)
User time (seconds): 2.50
System time (seconds): 0.01
Percent of CPU this job got: 658%
Elapsed (wall clock) time (h:mm:ss or m:ss): 0:00.38
Voluntary context switches: 185
Involuntary context switches: 45
Maximum resident set size (kbytes): 61344
Interpretation:
658% CPU means the process averaged ~6.6 cores during the run.
The wall time is small (~0.38s), while total user CPU time is bigger (2.50s), because multiple cores were working simultaneously.
Context switches are relatively low. It looks like the threads mostly ran, rather than spent their lives begging for permission to run.
GIL run (Standard)
User time (seconds): 4.42
System time (seconds): 0.03
Percent of CPU this job got: 177%
Elapsed (wall clock) time (h:mm:ss or m:ss): 0:02.51
Voluntary context switches: 3705
Involuntary context switches: 274
Maximum resident set size (kbytes): 92320
Interpretation:
177% CPU means the process averaged ~1.8 cores during the run.
Wall time balloons (~2.51s) even though you have 8 threads, because the GIL serializes Python bytecode execution.
And the context switches… wow. 3705 voluntary switches vs 185 in free‑threading. That’s the OS watching threads take turns, wake up, get blocked, get rescheduled, repeat — a whole choreography whose only artistic goal is contention.
This is one reason GIL‑heavy CPU workloads often feel like:
“Congrats, you added threads — now you have more scheduling overhead and less happiness.”
Side-by-Side Results
“But the script prints per-thread CPU time…”
This is worth being precise about (and it’s a common benchmarking foot‑gun).
The script prints something like:
“Active CPU Time per Thread”
But what it’s actually summing is:
per-chunk wall duration (
end_time - start_time) for each thread
That number is still useful — it tells you how long each thread spent inside chunks — but it is not OS CPU time. Wall time includes pauses, waiting, and preemption.
That’s exactly why /usr/bin/time -pv is such a killer pairing:
the script gives you chunk‑level structure (good for visualization)
time -pvgives you OS‑level CPU truth (good for “is this real parallelism?”)
Timeline + time -pv together = triangulation. No vibes. Just physics.
What’s happening under the hood
Think of the GIL like a single checkout lane at a busy supermarket.
With the GIL: 8 customers (threads) are lined up. They constantly step forward, get told “not yet,” step back, try again. That movement isn’t free — it causes churn (context switches).
With free‑threading: you opened multiple lanes. Suddenly, people actually check out in parallel and the store stops looking like a Kafka novel.
Free‑threading doesn’t make Python magically faster per instruction.
It makes Python stop serializing CPU‑bound threads behind one global lock.
Caveats
This is a microbenchmark, designed to isolate the GIL effect on CPU‑bound threading.
Real apps include:
I/O (where threads were already often fine)
C extensions (some already release the GIL; some won’t be free‑threading‑ready yet).
your own locks (which can become the new bottleneck)
So no, this doesn’t mean “everything is 6× faster now.”
It means: CPU‑bound Python threads can finally scale in principle — and you can measure it cleanly.
Closing thought
The GIL era taught Python developers good habits:
use processes for CPU
use threads for I/O
push heavy compute into native code
Free‑threading doesn’t delete those lessons — it adds a new option: Threads can be real CPU parallelism now.
And with timeline plots + /usr/bin/time -pv, you can prove it without starting a holy war.
Nice!
I'd also like to see the results of a single-threaded approach. Will it be faster than multi-threaded due to a lower number of context switches?